
On time delivery rate measures the share of orders that arrive by the date you promised the customer, expressed as a percentage of total deliveries. Anything below 90% puts you at risk of losing customers to competitors; 95% counts as a solid operational target, and 98% or higher is treated as world-class across most retail and logistics benchmarks. But the number only means something if you measure it correctly. Two companies can both report “96% OTD” and mean completely different things, depending on whether they timestamp delivery at the warehouse dock, the carrier’s scan, or the customer’s doorstep. Get the measurement rules wrong, and the metric becomes a number that flatters your ops team while your customers quietly churn.
Key Takeaways
On time delivery rate only improves when you measure it against the customer’s actual promise date and fix the highest-leverage root cause first, not the easiest one.
| Point | Details |
|---|---|
| Use the standard formula | Divide on-time deliveries by total deliveries and multiply by 100, tracked at order or line level. |
| Target 95% as solid, 98%+ as elite | Treat anything below 90% as a customer-loss risk requiring immediate diagnosis. |
| Measure against customer promise date | Avoid substituting an easier internal milestone like warehouse ship date. |
| Diagnose before you fix | Run a Pareto analysis on late orders before investing in carrier or inventory changes. |
| Fix receiving speed first | Slow inbound check-in is a common hidden driver of stockouts misread as demand problems. |
Table of Contents
- What Is the On Time Delivery Rate Formula?
- What Counts as a Good On Time Delivery Benchmark?
- How Should You Measure OTD Without Fooling Yourself?
- Why Is Your On Time Delivery Rate Falling Short?
- Which Operational Levers Actually Raise OTD?
- How Should You Monitor and Report OTD Over Time?
- Is OTD the Same as OTIF or Delivery Performance?
- How Usiprep Improved On Time Delivery for Ecommerce Sellers
- What Most OTD Advice Gets Wrong
- Sources
What Is the On Time Delivery Rate Formula?
The standard calculation is simple: divide the number of orders delivered on or before the promised date by total deliveries, then multiply by 100. If you shipped orders last month and most of them arrived by the promised date, your OTD rate reflects the proportion of on-time deliveries relative to total deliveries. That’s the baseline formula every supply chain team should know cold.
But “orders” isn’t the only way to slice it, and picking the wrong unit can quietly distort your reporting. Consider these four common variants:
- Order-level OTD counts an entire order as late if even one line item misses the date. This is the strictest and most customer-accurate view.
- Line-level OTD measures each line item independently, which smooths out the impact of one bad SKU on an otherwise perfect order.
- Volume-weighted OTD weights each delivery by unit count or pallet volume, useful when a handful of massive shipments matter more than dozens of small ones.
- Revenue-weighted OTD weights by dollar value, which matters most if your highest-margin SKUs are also your most delay-prone.
Whichever variant you choose, record both the customer’s original requested date and the confirmed promise date you gave them. User Solutions research on OTD reporting notes that tracking both figures separately gives leadership a truer picture of the customer experience, since a “promise” that already padded in extra days looks artificially healthy if you only measure against it.
What Counts as a Good On Time Delivery Benchmark?
Three numbers anchor almost every industry conversation about OTD, and they’re worth memorizing.
- Below 90% is the market floor. Dip under it and you’re in territory associated with real customer-loss risk.
- 95% is considered a solid, defensible target for most ecommerce and B2B operations.
- 98% or higher is world-class, the range top-tier 3PLs and manufacturers use to differentiate themselves.
Those bands aren’t universal, though. Automotive OEM supply chains often demand OTD north of 98% because a missed part delays an entire assembly line, not just one customer order. Perishables and pharma operations run even tighter, since a late delivery there isn’t just an inconvenience, it can mean spoiled inventory or a compliance violation. A DTC apparel brand shipping non-urgent goods has more room to breathe than a supplier feeding a just-in-time manufacturing line.
Set your own target by working backward from two pressures: platform penalties and customer tolerance. Amazon and other marketplaces apply account-level penalties once seller-fulfilled OTD drops below their thresholds, so sellers on those channels should treat 95% as a minimum, not a stretch goal. On the customer side, Statista’s research on delivery expectations shows tolerance for delay varies significantly by category and price point, which means your acceptable OTD floor should reflect what your specific buyers expect, not a generic industry average.
How Should You Measure OTD Without Fooling Yourself?
Measure primarily against the date you promised the customer, not against an internal milestone like “shipped from warehouse.” That distinction sounds obvious until you realize how many ops dashboards quietly default to the easier internal number. Symestic’s analysis of OTD as a KPI makes the point directly: on-time delivery is a customer-facing metric that can diverge sharply from internal logistics KPIs, and tracking only the internal version risks masking real failures the customer actually experiences.
Where you draw the timestamp changes the number dramatically. Goods-issue (when it leaves your warehouse), carrier scan (when the carrier picks it up), and customer receipt (when it actually lands on their doorstep) can each produce a different OTD percentage for the exact same set of orders. A practical diagnostic worth running quarterly: sample a batch of orders and capture both your goods-issue timestamp and the customer’s goods-receipt timestamp side by side. The gap between them usually exposes carrier transit problems or feedback-loop gaps you didn’t know existed.
Tolerance windows matter too. Some operations allow a window of plus or minus zero to two business days around the promise date, depending on the industry and shipping method. That’s reasonable when it’s disclosed upfront. It becomes a problem when the window quietly widens after the fact to rescue a bad month’s numbers.
Watch for these traps specifically:
- Changing the promise date retroactively after a delay, which erases the “miss” from the record instead of fixing the cause.
- Mixing timestamp sources month to month, so trend lines look smoother than reality.
- Chasing a high peak OTD while ignoring volatility, when a stable 95% is operationally healthier than a number that swings between 88% and 99%.
Pro Tip: Pull a random sample of “on-time” orders once a quarter and manually verify the promise date against your CRM’s original customer communication. If the two don’t match, someone adjusted the record after the fact, and your OTD number is lying to you.
Why Is Your On Time Delivery Rate Falling Short?
Low OTD almost always traces back to one of five root causes, and finding which one is dragging your numbers down is a diagnostic exercise, not a guessing game.
- Overselling against inaccurate inventory. If your system shows stock that isn’t physically there, the order gets confirmed on a promise date you can’t hit.
- Slow order processing. Every extra hour between order placement and pick/pack pushes your ship date closer to the promise deadline, with no buffer left for carrier delays.
- Fulfillment errors. Mis-picks and mislabels trigger returns and reships that blow past any original promise date.
- Carrier last-mile failures. Even a perfect warehouse operation can’t fix a carrier that consistently runs late on a specific route.
- Demand spikes. Flash sales and seasonal peaks overwhelm capacity that was sized for average, not peak, volume.
To find out which one applies to you, run these diagnostics in order. Start with a Pareto analysis of late orders, most operations find that 20% of SKUs or 20% of shipping lanes account for 80% of the misses. Follow with a time-gap analysis comparing order-placed, goods-issue, and delivered timestamps to see where the hours actually disappear. Then split OTD by carrier and by sales channel to isolate whether one partner or one platform is dragging the average down. Finally, run an ABC analysis on SKUs, since your highest-velocity items often reveal inventory sync problems that lower-volume SKUs mask. If the carrier-split view shows one carrier consistently underperforming on a specific lane, that’s a carrier problem. If the time-gap analysis shows hours lost between order and pick, that’s a process problem, not a shipping problem, and no amount of carrier negotiation will fix it. Usiprep’s guide on how fulfillment errors happen walks through the mis-pick and mislabel side of this in more depth.
Which Operational Levers Actually Raise OTD?
Fixing OTD is rarely one big change. It’s usually five or six smaller ones stacked together, and the order you tackle them in matters.
Inventory controls come first, because you can’t hit a promise date on stock you don’t actually have. Real-time inventory sync between your storefront and warehouse management system prevents overselling before it happens. Setting safety stock levels by individual SKU, rather than one blanket buffer across your catalog, protects your fastest-moving products without tying up cash in slow movers. Channel allocation strategies, splitting inventory pools across Amazon, your own site, and wholesale, stop one channel’s promise from cannibalizing stock another channel already committed to a customer. Usiprep’s ecommerce order management guide covers channel allocation in more detail.
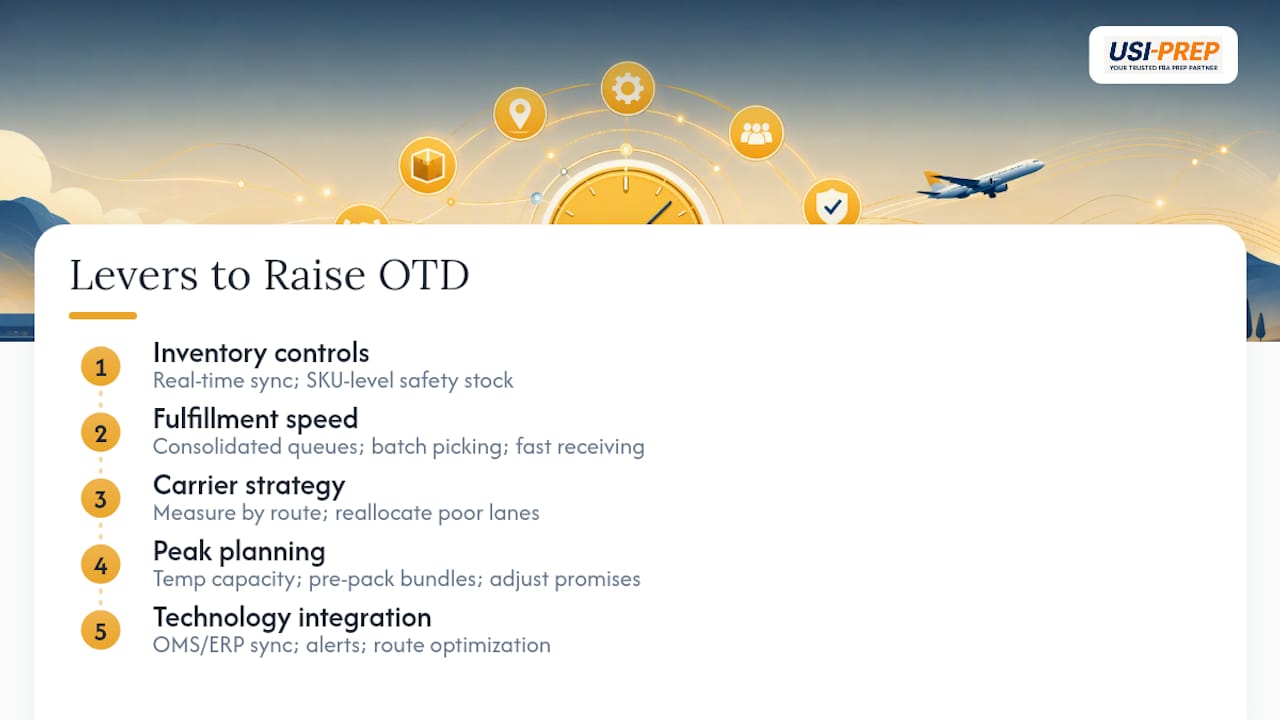
Fulfillment speed is the second lever. A consolidated order queue instead of siloed channel-by-channel processing cuts the time orders sit waiting for attention. Batch picking, grouping similar SKUs into single picking runs, reduces walk time inside the warehouse. Faster receiving and check-in on inbound inventory matters just as much, since stock that’s sitting in a receiving queue instead of on a shelf can’t fulfill anything.
Carrier strategy is the third. Measure OTD by specific route, not just by carrier overall, since one carrier can be excellent in the Northeast and mediocre in the Southwest. Reallocate volume away from underperforming lanes, and where contract terms allow it, negotiate SLA-based penalties or bonuses tied directly to route-level performance.
Peak planning is the fourth. Forecast-driven temporary capacity, pre-packing popular bundles ahead of known demand spikes, and honest promise-date adjustments during peak windows all beat quietly missing dates and hoping customers don’t notice.
Technology ties it together. OMS and ERP integration eliminates the manual re-entry errors that create false promise dates in the first place, while exception alerts and route optimization catch problems while there’s still time to fix them before the delivery window closes.
Pro Tip: If you only fix one thing this quarter, fix receiving speed. Slow inbound check-in is the most common hidden cause of stockouts that get misdiagnosed as demand-forecasting failures.
How Should You Monitor and Report OTD Over Time?
A dashboard that only shows one blended OTD number is nearly useless for diagnosis, even if it’s fine for a board slide. Build yours with five views: overall OTD, OTD broken out by carrier, OTD broken out by SKU ABC tier, a trend line showing volatility (not just the average), and a tolerance-window view showing how many “on-time” deliveries were only on time because the window got generous.
Reporting cadence should match the audience. Operations teams need daily visibility so they can catch a bad morning before it becomes a bad week. Mid-level management needs a weekly exceptions report focused on what broke and why. Leadership needs a monthly summary that connects OTD trends to revenue and customer retention, not raw operational detail.
Governance is what keeps the metric honest over time. Document your primary measurement rule (which timestamp counts, which tolerance window applies) in writing, so it can’t drift department by department. Set clear escalation triggers, for instance, three consecutive days below 92% automatically flags the ops lead, not just the CEO’s dashboard. Assign explicit ownership for corrective action, because a metric with no owner is a metric nobody fixes.
- Track OTD overall and segmented by carrier, SKU tier, channel, and time period.
- Match reporting cadence and depth to the audience: daily for ops, weekly for management, monthly for leadership.
- Put your measurement rules and escalation triggers in writing so they survive staff turnover.
Consider Usiprep’s warehouse technology checklist if you’re evaluating whether your current systems can even produce this level of segmentation automatically.
Is OTD the Same as OTIF or Delivery Performance?
No, and conflating them causes real reporting confusion. OTD measures only timing, whether the order arrived by the promised date. OTIF (on time, in full) adds a completeness check: the order has to arrive on time and with every item included, no partial shipments or backorders quietly excluded. Delivery Performance (DP) is a broader composite KPI that can be calculated as volume-based or singular-order-based, and it’s useful specifically when you need both timing and completeness reflected in one number rather than tracked separately.
If your customers rarely experience partial shipments, plain OTD is probably sufficient. If backorders and split shipments are common in your catalog, OTIF or DP will tell you more about the actual customer experience than OTD alone ever could.
How Usiprep Improved On Time Delivery for Ecommerce Sellers
Usiprep was founded by former Amazon sellers who got tired of watching unreliable 3PLs miss promise dates while blaming carriers, inventory, or “seasonal volume.” That background shapes how the company measures its own performance: from the customer’s promised date, not from a warehouse-friendly internal milestone.
Usiprep reports a 98.9% on-time delivery rate across client shipments, alongside typical fulfillment cost reductions of 30% for the brands it works with. Those figures reflect faster inventory check-in and full visibility into every stage of the fulfillment pipeline, the same transparency this article recommends building into your own OTD reporting.
If you’re weighing whether to fix OTD in-house or outsource it, ask three questions first: Is your inventory sync problem structural (systems that don’t talk to each other) or operational (a process nobody follows)? Is your carrier performance issue isolated to one lane or systemic across your network? If the honest answer to any of those is “no,” a specialized fulfillment partner is worth evaluating, and firms like The 3PL Cowboy offer independent advisory perspective if you want a second opinion before committing.
If it’s your FBA prep pipeline specifically causing the delay, Usiprep’s FBA prep requirements checklist walks through the exact receiving and labeling steps that most often bottleneck check-in speed, and the guide to speeding up FBA prep covers the operational side in more depth.

What Most OTD Advice Gets Wrong
That misses the point entirely. The research behind this article points somewhere more specific: the measurement rule you choose matters more than the improvement tactic you pick afterward. A team obsessing over carrier negotiations while measuring OTD against goods-issue instead of customer receipt is optimizing the wrong problem.
The conventional advice also underrates volatility. Stability signals a process that works under normal stress. Volatility signals one that only works when nothing goes wrong.
If you take one thing from this, prioritize the measurement rule before the fix. Get the timestamp and promise-date definition right first. Everything else, inventory sync, carrier reallocation, peak planning, only works if you’re measuring the real problem in the first place.
— Akbar
Sources
- The role of on-time delivery in logistics management
- On-time delivery metrics
- Delivery Performance 101: How to Measure, Optimize, and Boost Supply Chain Reliability
- Delivery KPIs your board will care about: the essential 8