
Mispicks, oversized cartons, phantom inventory, and slow returns processing are the costliest fulfillment inefficiencies most operations are running right now, and each one drains margin through a different channel. A single mispick can cost $22 to $80+ once you add return freight, reship, and customer service. An oversized carton triggers dimensional-weight penalties on every single label. Phantom stock kills a sale before the picker ever leaves the slot.
Here is where each inefficiency hits your cost structure:
- Mispicks and mislabels: inflate labor (rework), shipping (reship), and customer service costs
- Poor cartonization and DIM weight: add carrier surcharges to every outbound parcel
- Unnecessary touches and travel time: burn labor hours without adding value
- Slow or unmanaged returns: create reverse-logistics expense and dead inventory
- Inaccurate inventory data: trigger expedited replenishment, lost sales, and wasted ad spend
The sections below walk through concrete floor-level examples, a cost-bucket breakdown with example math, the KPIs that surface problems fastest, a one-to-two day audit checklist, and a prioritized fix list.
Table of Contents
- What are the most costly fulfillment inefficiencies you can actually see?
- How do these failures translate into real dollar costs?
- What should you audit first in a one-to-two day operational review?
- What fixes deliver the highest return, and in what order?
- Key Takeaways
- The inefficiency that operations teams consistently underestimate
- Usiprep helps you cut fulfillment costs without rebuilding from scratch
- Useful sources and further reading
What are the most costly fulfillment inefficiencies you can actually see?
Most fulfillment waste is not abstract. It shows up as a picker walking an extra 200 feet, a box two sizes too large, or a return sitting uninspected for a week. These are the examples of costly fulfillment inefficiencies that compound fastest.
-
Mispick: A picker pulls SKU A instead of SKU B. The wrong item ships. The customer contacts support, a return label gets issued, the item travels back, gets inspected, and the correct item reshipped. That sequence can easily consume four to six labor touches beyond the original pick. Research puts the full ripple cost at $22–$80+, and the base shipping cost often multiplies roughly fourfold when returns and re-ship are included.
-
Mislabel: A label prints correctly but gets applied to the wrong carton. In an FBA context, this triggers a compliance failure, a potential stranded-inventory event, and a prep rework fee. In DTC, it means the wrong customer gets the wrong product, and you pay to fix both sides.
-
Missing kit component: A bundle ships with one item missing. The customer receives an incomplete order. You now owe a replacement component, a return label if they reject the partial shipment, and a customer service interaction. Kit errors are especially expensive because the per-order value is usually higher.
-
Wrong pack quantity: A case pack of 12 ships as a case of 6. Downstream, a retail buyer short-receives, files a chargeback, and your accounts-payable team spends time disputing it. Chargebacks in retail can run 1–3% of invoice value per incident.
-
Damage from poor packaging: Insufficient dunnage or an oversized box that allows product to shift in transit produces damage claims. The cost is the replacement unit, the return freight, and the customer service time. For fragile or high-value SKUs, this is a recurring margin leak.
-
Oversized carton and DIM weight penalty: Shipping a product that weighs 2 lbs in a box that dimensions out to 5 lbs means you pay for 5 lbs on every label. Across thousands of orders, that gap compounds. Cartonization adjustments alone can reduce DIM-weight charges 15–25% without changing your carrier contract.
-
Split shipment: An order for three SKUs ships in two boxes because inventory is split across locations or because no cartonization logic exists. The customer pays one shipping charge; you pay two. Split-shipment rates above 5% of orders are a reliable signal of slotting or inventory-positioning problems.
-
Late carrier cutoff and premium freight: An order that misses the daily carrier pickup gets held overnight and ships next-day air to meet the promised delivery date. That upgrade can cost $15–$40 more per parcel than the original ground rate. Unpredictability in fulfillment timing drives exactly this kind of expedited-freight spend, and it compounds with wasted marketing spend when customers who paid for fast delivery get it late anyway.
-
Manual weigh and dimension errors: A pack station without a scale or dimensioner relies on the operator to enter weight and dimensions. Wrong entries produce carrier invoice adjustments, often weeks later, that show up as miscellaneous charges. Poor data discipline at pack time is one of the most consistent sources of hidden cost in fulfillment operations.
-
Phantom stock and out-of-stocks: The WMS shows 50 units on hand; the physical count finds 12. Orders get accepted, then fail to ship. You cancel, issue apologies, and lose the customer. The upstream cost is wasted ad spend driving traffic to a product you cannot fulfill.
-
Returns processing delays: A return arrives, sits in a queue for five to ten days, and gets inspected and restocked slowly. During that window, the unit is neither sellable nor written off. Per-return handling costs range from $2.50 to $8+, and categories with return rates above 20% face outsized margin pressure from this alone.
This stacking effect, where one operational failure triggers two or three downstream costs, is why understanding how fulfillment errors happen is the first step before any fix.
How do these failures translate into real dollar costs?
Every operational failure maps to one or more accounting buckets. Knowing which bucket an inefficiency hits tells you who owns the fix and where to look for savings.
The six cost buckets
Warehouse labor covers picks, packs, rework, re-picks, and exception handling. Manual fulfillment can take 3–7 minutes per order in many operations, and every error adds at least one full cycle on top of that.
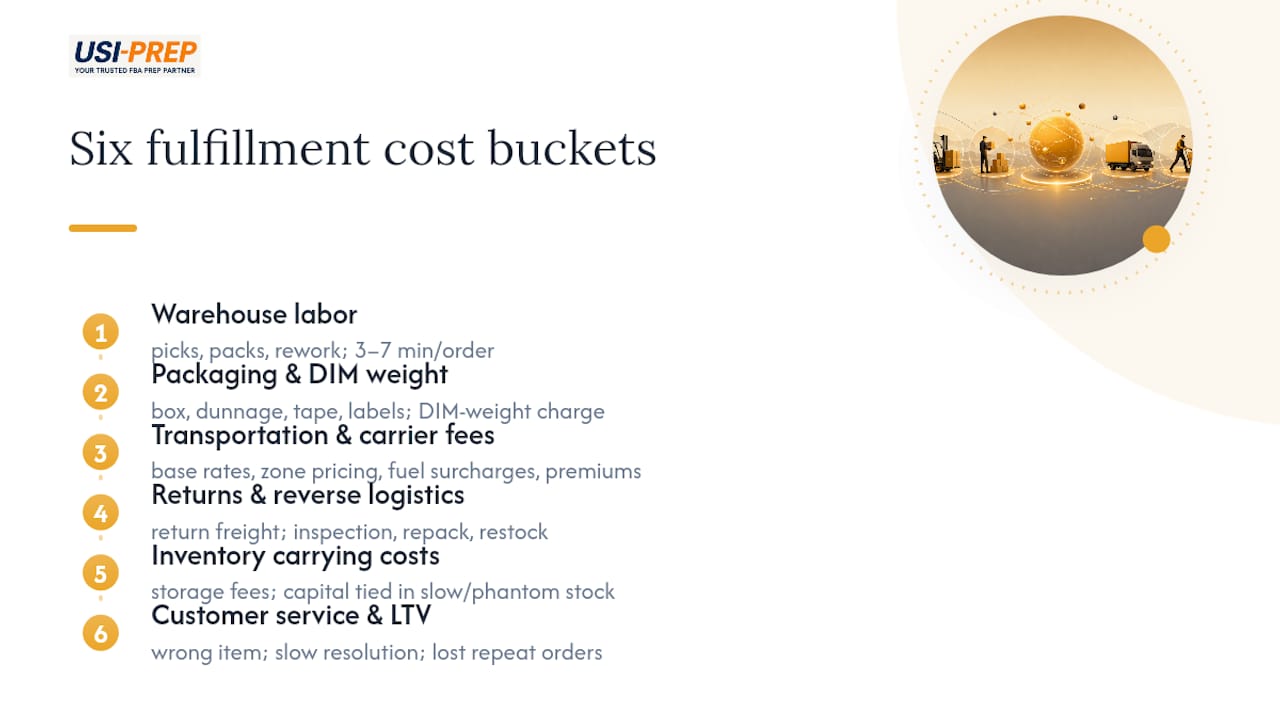
Packaging materials and DIM weight includes the box, dunnage, tape, and labels, plus the carrier’s dimensional-weight charge when the billed weight exceeds the actual weight.
Transportation and carrier fees covers base parcel rates, zone-based pricing, fuel surcharges, residential delivery fees, and premium freight when orders miss cutoffs or need reshipping.
Returns and reverse logistics includes inbound return freight, inspection labor, repack, restock, and disposition of unsellable units.
Inventory carrying costs covers storage fees, capital tied up in slow-moving or phantom stock, and the expedited replenishment cost when a stockout occurs. Repositioning inventory to 45–60 days of forecasted demand in an external node is one of the fastest ways to reduce storage-fee blowout.
Customer service and lost lifetime value is the hardest to quantify but often the largest. A customer who receives a wrong item and a slow resolution rarely reorders.
Cost-bucket mapping table
| Inefficiency | Primary cost bucket | Secondary bucket | Sample per-incident range |
|---|---|---|---|
| Mispick (DTC parcel) | Labor rework + reship | Customer service + lost LTV | $22–$80+ |
| Oversized carton (DIM penalty) | Carrier fees | Packaging materials | $0.50–$3+ per order |
| Split shipment | Carrier fees (double label) | Labor (two pack cycles) | $5–$20 per split |
| Returns processing delay | Reverse logistics | Inventory carrying | $2.50–$8+ per return |
| Phantom stock / out-of-stock | Lost sales + expedited replenishment | Wasted ad spend | Variable, often $50–$200+ per incident |
| Late cutoff / premium freight | Transportation | Labor overtime | $15–$40 per upgrade |
Statistic: A mispick’s full ripple cost frequently multiplies the base shipping cost by roughly 4x when return freight, reship, and customer support are included.
Two example calculations
DTC small-parcel mispick stack (1,000 orders/month, 1.5% error rate):
15 mispicks per month. At a mid-range cost of $45 per incident (reship + return label + one service contact), that is $675/month, or $8,100/year, from a single error type at a modest volume. At 5,000 orders/month with the same error rate, the annual exposure crosses $40,000 before accounting for lost repeat purchases.

DIM-weight penalty stack (5,000 parcels/month, average 1.3 lbs overbilled):
A cartonization pilot that reduces billed weight by 1.3 lbs per parcel at a carrier rate of roughly $0.52 per lb saves approximately $0.68 per order. At 5,000 orders, that is $3,400/month, or $40,800/year, from box-size optimization alone. Combined cartonization and rate-shopping programs can approach 25–35% per-order savings in many DTC operations.
Fulfillment efficiency connects directly to profit recovery in ways that rarely show up in a single line item. The cost is distributed across labor, freight, and service, which is exactly why it stays hidden until someone runs the math.
What should you audit first in a one-to-two day operational review?
Run these steps in order. The first three typically surface 80% of the highest-impact waste.
-
Walk a sample order from pick to pack. Pull 20–30 random orders and physically follow the pick path. Time each step. Note travel distance, any backtracking, and how often the picker has to search for a location. Red flags: travel time exceeding 60% of total pick time, any slot that requires a picker to visit the same aisle twice for one order.
-
Audit the pack station and carton selection. Check whether packers are choosing cartons from a defined set or eyeballing it. Measure five to ten packed cartons: record actual product dimensions versus the carton used. If the average void fill exceeds 30% of carton volume, cartonization is costing you on DIM weight. Red flag: no defined carton matrix, no scale at the station.
-
Inspect the returns queue. Count units sitting uninspected for more than 48 hours. Check whether a triage decision tree exists (resell as-is, repack, liquidate, dispose). If returns are batched and processed weekly rather than daily, you are carrying dead inventory and missing restocking revenue. Red flag: returns queue older than three days with no disposition decision.
-
Pull a carrier invoice DIM/weight analysis. Request the last 30 days of carrier invoices and compare billed weight to manifested weight for a sample of 100 shipments. Any consistent gap between what your system recorded and what the carrier billed is a data-discipline problem at pack time. Red flag: more than 5% of shipments with a billed-weight adjustment.
-
Review slotting and pick-path logic. Check whether your top 20% of SKUs by velocity are slotted in the closest, most ergonomic positions. In many operations that have grown organically, fast-movers end up in inconvenient slots because no one re-slotted after the assortment changed. Red flag: a top-10 velocity SKU slotted in a back aisle or upper shelf.
-
Check WMS and OMS integration points. Identify any manual data-entry step between order receipt and label print. Each manual step is a potential error and a time cost. Red flag: order data copied by hand between systems, or a daily batch sync instead of real-time feed.
Pro Tip: Before the full audit, run a 30-minute carton-size pilot: pick 50 orders and pack them in the smallest carton that fits without forcing. Compare the billed weight to your standard carton. This single exercise often reveals $0.50–$1.50 per order in immediate savings and takes less than a morning to complete.
Warehouse technology features worth checking include scan-to-verify at pick, weight confirmation at pack, and real-time inventory sync, all of which eliminate the most common manual-entry failure points.
What fixes deliver the highest return, and in what order?
Sequence matters. Start with changes that require no capital and deliver results within 30 days, then move to process investments, then technology.
-
Cartonization and box-size optimization (Week 1–2). Define a carton matrix of five to seven sizes that covers 90%+ of your SKU volume. Assign each SKU a recommended carton. Post the matrix at every pack station. This alone can reduce DIM-weight charges 15–25% and cuts packer decision time. Owner: operations manager. Measurement: billed weight per order before and after.
-
Slotting and pick-path engineering (Week 2–4). Pull velocity data from your WMS for the last 60–90 days. Move the top 20% of SKUs by order frequency to your closest, most accessible slots. Re-run pick paths to minimize backtracking. Owner: warehouse supervisor. Measurement: lines per labor hour, pick time per order.
-
Scan validation at pick and pack (Week 2–4). If your WMS supports scan-to-verify, activate it. If not, implement a simple barcode scan at pack close that confirms the SKU matches the order. This single control reduces mispick rates dramatically in most operations. Owner: IT or WMS admin. Measurement: mispicks per 1,000 lines.
-
Rule-based carrier selection and rate shopping (Week 3–6). Set routing rules that automatically select the lowest-cost carrier and service level that meets the promised delivery date. For eligible lanes, zone-skipping can reduce parcel costs 15–30%. Manual fulfillment decisions scale linearly and become more expensive at volume; automating rate selection removes that scaling problem. Owner: logistics manager. Measurement: average freight cost per order.
-
Returns triage and fast-track-to-stock (Week 4–8). Build a decision tree with four outcomes: resell as-is, repack and resell, liquidate, or dispose. Assign a returns processor to run triage daily rather than weekly. Target a 48-hour return-to-sellable cycle for grade-A units. Owner: returns supervisor. Measurement: days-to-restock, return processing cost per unit.
-
Weekly KPI dashboard with ownership (Ongoing). Assign one owner to each KPI. Review weekly. Any metric that moves more than 10% in the wrong direction triggers a root-cause conversation within 48 hours. Hidden costs live in workflow data that no one is measuring; a dashboard makes them visible before they compound.
Make-or-buy guidance: Activating existing WMS rules for scan validation and carton selection costs nothing beyond configuration time. Buying a third-party cartonization tool makes sense when your SKU count exceeds a few hundred and your carton matrix is too complex to manage manually. For labor capacity during peak seasons, a short-term 3PL arrangement is usually faster and cheaper than hiring and training seasonal staff. Deciding between 3PL and self-fulfillment comes down to volume predictability and whether your current operation has the system maturity to execute fixes in-house.
Pro Tip: Sequence these fixes so each one generates data that informs the next. Cartonization data tells you which SKUs are most DIM-sensitive. Slotting data tells you which SKUs drive the most travel time. Running them in parallel without measurement means you cannot attribute savings to a specific change.
Fulfillment cost reduction strategies that combine cartonization, slotting, and carrier optimization tend to compound: each fix reduces the base cost that the next fix works against.
Key Takeaways
Mispicks, oversized cartons, phantom inventory, and slow returns are the four highest-impact fulfillment inefficiencies, and fixing them in sequence, starting with cartonization and scan validation, typically delivers the fastest measurable cost reduction.
| Point | Details |
|---|---|
| Mispick cost is higher than it looks | The full ripple cost of a mispick can be several times the base shipping cost when returns and reship are included. |
| Cartonization is the fastest ROI fix | Reducing DIM-weight overbilling by right-sizing cartons can cut carrier fees 15–25% with no contract changes. |
| KPIs surface hidden costs | Track mispicks per 1,000 lines, lines per labor hour, and split-shipment rate weekly to catch problems before they compound. |
| Returns need daily triage, not weekly batches | A 48-hour return-to-sellable cycle for grade-A units prevents dead inventory and reduces per-return handling cost. |
| Usiprep delivers documented outcomes | Usiprep reports 98.9% on-time delivery and up to 30% cost reductions for clients, with capabilities covering FBA prep, cartonization, returns, and multi-carrier execution. |
The inefficiency that operations teams consistently underestimate
Most operations teams focus their cost-reduction energy on carrier contracts. They negotiate rate cards, chase volume discounts, and benchmark zone pricing. That work matters, but it addresses the symptom rather than the source.
The real leverage is almost always upstream: the carton that is two sizes too large, the pick path that sends a picker to four aisles for a two-item order, the returns queue that nobody owns on Tuesday morning. These are not glamorous problems. They do not show up in a single line on a P&L. They hide in labor variance, in miscellaneous carrier adjustments, in customer service ticket volume that everyone attributes to “product issues.”
What consistently surprises operations leaders is how quickly a structured audit surfaces the dollar amounts. A one-day carton audit and a 30-minute pick-path walk will usually identify more savings than six months of carrier negotiation. The reason is simple: carrier contracts are already optimized by people whose full-time job is negotiating them. Your pack station probably has not been audited since the last warehouse move.
The other underestimated factor is compounding. A 1.5% mispick rate sounds manageable. But at 10,000 orders per month, that is 150 errors, each triggering a return, a reship, and a service contact. The math gets uncomfortable fast, and it gets worse during promotional spikes when error rates tend to climb precisely when volume is highest.
Fix the floor first. The carrier savings will still be there when you get to them.
Usiprep helps you cut fulfillment costs without rebuilding from scratch
Brands that have already identified their inefficiencies, whether it is DIM-weight penalties on every parcel, a mispick rate that spikes during promotions, or returns sitting uninspected for days, need a partner who can execute the fixes, not just describe them.
Usiprep’s fulfillment model is built around the exact cost buckets this guide covers: right-sized cartons, scan-validated picks, fast returns triage, and multi-carrier rate execution, all with transparent, itemized pricing so you can see exactly where your money goes. Founded by former Amazon sellers, the team understands FBA compliance, inventory accuracy, and the operational discipline that keeps on-time rates above 98%.
What you get when you work with Usiprep:
- A fulfillment audit that maps your current cost exposure to specific operational failures
- FBA prep and DTC fulfillment with carton optimization built into every shipment
- Returns processing with defined triage rules and fast-track-to-stock for grade-A units
- Real-time inventory visibility and platform integrations that eliminate phantom stock
Start with the FBA prep requirements checklist to see exactly where your current prep process may be creating compliance costs, or review Usiprep’s fulfillment cost reduction services to get a clear picture of what a structured remediation engagement looks like for your volume.
Useful sources and further reading
- How to Cut Fulfillment Costs by 30% Without Switching Your 3PL — Ecommerce Times
- Cost of 2026 order fulfillment — Cleverence
- Order Fulfillment Errors: The Real Cost [2026 Data] | VNDLY Blog | VNDLY
- The Hidden Cost of Fulfillment Unpredictability (And How It Kills Margins) | Slotted
- The surprising cost of manual order fulfillment, and how to automate your way out | Stacker
- Reduce Order Fulfillment Costs Without Slowing Delivery
- The True Cost of Supply Chain Inefficiencies
- Costs of Excess Inventory | RetailOwner
- USIPrep