
Cost per order fulfillment is the total expense your business incurs to process, pack, and deliver a single customer order. It pulls together every operational cost from the moment inventory arrives at your warehouse to the moment a package lands at a customer’s door, including returns. The fully loaded metric covers both fixed costs like facility rent and management overhead, and variable costs like pick labor, packaging materials, and outbound shipping. Get this number right, and you have a real basis for pricing decisions, 3PL negotiations, and margin planning. Miss it, and you are likely undercosting fulfillment by 20–40%.
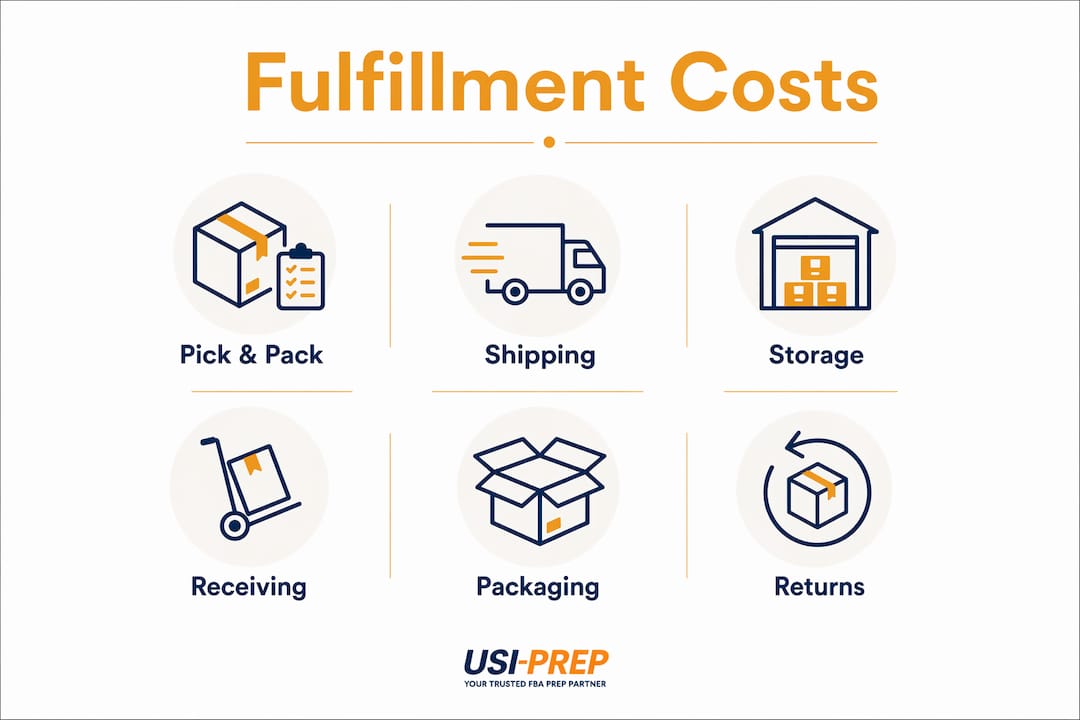
The six core cost categories that feed into every order:
- Receiving: Unloading, counting, inspecting, labeling, and putting inventory into storage locations
- Storage: Space occupied by your SKUs multiplied by how long they sit; slow-moving inventory inflates this fast
- Pick and pack: Locating items, pulling them, verifying accuracy, selecting packaging, sealing, and labeling
- Packaging materials: Boxes, mailers, dunnage, tape, inserts, and branded packaging
- Shipping: Outbound carrier costs; often tracked separately but integral to your true per-order economics
- Returns processing: Receiving, inspecting, restocking or disposing of returned units
Table of Contents
- What makes up your order fulfillment expenses?
- How to calculate fulfillment cost per order
- What does fulfillment actually cost in the US in 2026?
- How to reduce your cost per order fulfillment
- Which metrics should you track alongside cost per order?
- Industry insights and what Usiprep clients actually see
- Usiprep gives you lower costs and real visibility from day one
- Key Takeaways
What makes up your order fulfillment expenses?
Understanding each cost bucket separately is what lets you actually move the needle on any one of them.
Receiving
Every inbound shipment carries a cost before a single order ships. Receiving covers unloading pallets or cartons, counting units against purchase orders, quality inspection, applying labels if needed, and moving inventory to its storage location. At a 3PL, this typically appears as a receiving fee of $25–$50 per inbound pallet, billed separately from your pick/pack rate.
Storage
Storage cost depends on how much space your inventory occupies and how long it sits there. Faster inventory turnover lowers your per-order storage allocation; slow-moving SKUs inflate it dramatically. Pallet storage at a 3PL runs $18–$28 per pallet per month in 2026, while bin or shelf storage runs $1.25–$3.00 per bin per month.
Pick and pack labor
This is the largest controllable cost component for most operations, accounting for 40–55% of total fulfillment cost per order. It covers locating items in the warehouse, pulling them from storage, verifying accuracy, selecting the right packaging, packing, sealing, and applying the shipping label. Pick and pack labor runs a few dollars per order across verticals, with a typical B2C average around the mid-range.

Packaging materials
Boxes, mailers, polybags, tape, dunnage, and branded inserts all add up. Standard packaging materials typically range from low to moderate cost per order for basic mailers or boxes, with higher costs for fragile homewares that require protective packaging. Right-sizing your packaging reduces dimensional weight fees from carriers, which is where the real savings compound.
Shipping
Shipping postage is generally the largest single cost in order economics, often accounting for 50–70% of total fulfillment cost. Because carrier rates fluctuate with fuel surcharges and zone pricing, many operators track shipping separately from warehouse fulfillment costs. That said, you cannot understand your true cost per order without including it.

Returns processing
Returns are the cost category most brands forget to allocate. Each returned order requires receiving, inspection, and a disposition decision: restock, refurbish, or dispose. Returns processing adds modest costs to your effective cost per order depending on your return rate, and 3PLs typically charge a separate fee per return processed.
How to calculate fulfillment cost per order
The core formula is straightforward:
Cost per order = Total fulfillment expenses ÷ Orders shipped in the same period
Brian Barry, president at F. Curtis Barry & Company, a Richmond, Virginia-based fulfillment consultancy, recommends measuring at least quarterly, with monthly being ideal. A full year of data captures seasonal peaks and reveals operational patterns that a single quarter can miss.
Step-by-step calculation:
- Pull all labor costs: receiving, pick and pack, shipping, returns, inventory control, supervision, and janitorial or security staff directly tied to operations
- Add facility costs: lease or mortgage, utilities, insurance, maintenance, and equipment depreciation
- Include packaging and shipping supplies
- Add returns and reverse logistics costs
- Add any 3PL fees: account management, kitting, special projects, and receiving fees
- Divide the total by orders shipped in the same period
What to exclude: Barry specifically recommends excluding outbound freight from the warehouse cost calculation, tracking it as a separate line item. Carrier rate swings can distort the warehouse efficiency picture.
Worked example: A brand ships several thousand orders in a month. Monthly costs include pick and pack labor, facility allocation, packaging materials, receiving fees, returns processing, and account management. Dividing total costs by orders gives a typical fulfillment cost per order excluding outbound shipping.
Pro Tip: When collecting cost data, pull from your 3PL invoice line by line, not just the headline pick/pack rate. Hidden fees like receiving, returns, kitting, and account management often add 15–25% to the number you see in the contract summary.
Common pitfalls:
- Omitting storage and receiving costs from the calculation
- Forgetting to allocate returns costs across all outbound orders
- Using the 3PL’s headline rate instead of the full invoice total
- Skipping overhead allocations like management labor and technology fees
For a detailed breakdown of true fulfillment cost components, including overhead allocation methods, the math gets more granular than most operators expect.
What does fulfillment actually cost in the US in 2026?
The average all-in fulfillment cost per order excluding outbound shipping typically falls within a moderate range. Including shipping costs shifts the total considerably depending on the product vertical.
Costs per order vary with volume, generally decreasing as monthly order volume increases, reflecting economies of scale in receiving, storage, pick & pack, materials, and returns. The total fulfillment cost excluding shipping declines at higher volumes.
Once outbound ground shipping is included, all-in cost per order varies by vertical such as apparel, beauty, food, electronics, and fragile homewares, with costs increasing accordingly. The spread is almost entirely carrier-driven, not warehouse-driven.
A healthy fulfillment cost target for most DTC brands is 8–12% of net revenue. Apparel brands with high return rates frequently land at 13–18% once returns are fully loaded back into the calculation. If you are above benchmark, the order of attack is dimensional weight first, packaging spec second, carrier rates third, and pick fees last.
Apparel often appears cheapest on a per-shipment basis but incurs additional return costs due to higher return rates compared to the average DTC rate. Returns add inbound label costs and inspection fees, which allocate extra costs across all outbound orders.
How to reduce your cost per order fulfillment
The biggest lever is almost never the one operators pull first. Pick and pack labor makes up 40–55% of total fulfillment cost per order, running a few dollars per order across every product vertical. Negotiating per-pick fees yields modest savings compared to other cost drivers. Shipping and packaging are where the real money moves.
Pro Tip: Focus packaging optimization and dimensional weight reduction before renegotiating pick fees. Since shipping accounts for 50–70% of total fulfillment cost, a $0.50 reduction in your effective carrier rate saves more per order than cutting pick fees by $0.25.
Key cost-reduction strategies:
- Right-size packaging: Reducing box dimensions cuts dimensional weight charges from UPS, FedEx, and USPS, often saving $0.50–$2.00 per order
- Split inventory across two fulfillment nodes: Shipping from one coast means half your orders cross four or five zones at full price; splitting inventory typically cuts 10–15% off the carrier line
- Negotiate carrier rates at volume: Brands hitting 1,500+ orders per month have real leverage to negotiate tiered pricing with 3PLs that have pre-negotiated UPS, FedEx, and USPS rates
- Track hidden 3PL fees: Receiving fees, returns processing, kitting, and account management add 15–25% to headline pick/pack rates; reconcile the full invoice monthly
- Match fulfillment channel to order volume: In-house fulfillment typically wins below about 50 orders per day or when custom packaging is required; 3PLs win for 50–2,000 orders per day; Amazon FBA is most cost-effective for low average order value Amazon channel orders under $25
Automation technology also plays a role. Warehouse management systems (WMS), barcode scanning, and guided pick workflows reduce mispicks and rework, which quietly drain margin through reshipping costs and customer service time. Automation tools designed for logistics operations can cut labor cost per order by reducing travel time and error rates in pick-and-pack workflows.
Operators who choose fulfillment channels based on convenience rather than cost analysis often find their current setup significantly more expensive than an optimized multi-channel approach. The right channel mix shifts as your volume and product mix evolve, so revisit the math at least annually.
Which metrics should you track alongside cost per order?
Cost per order is the headline number, but it does not tell you where the problem is. These companion metrics give you the granularity to act.
- Order fulfillment rate: Percentage of orders shipped complete and on time; a drop here often signals a labor or inventory problem that will show up in cost later
- Lines per labor hour: Maps directly to pick labor dollars; a decline signals slotting issues, travel time, or training gaps
- Returns rate by SKU: Isolates which products are driving reverse logistics costs; a 30% return rate on one SKU can distort your whole average
- Packaging cost per order: Tracks materials spend separately so dimensional weight projects have a clear baseline
- Shipping cost per order: The largest single line item; track by carrier, zone, and weight band to find negotiation leverage
- On-time dispatch rate: Predicts customer experience and reship risk before complaints arrive
Brian Barry recommends keeping cost data granular enough that issues can be identified by bucket, not just in aggregate. “You don’t want just one big bucket of costs,” he notes. “You want facility costs separated from labor, for example.” Tracking cost per order line alongside cost per order is also worth doing when your order size varies widely, since a single-item order and a five-item order carry very different labor profiles.
Industry insights and what Usiprep clients actually see
The most reliable benchmark is your own historical data, not an industry average. External ranges give you a sanity check, but your specific SKU mix, warehouse location, carrier contracts, and return rate determine your real number. The best operators track the fully loaded metric monthly and use it as a planning assumption, not a one-time calculation.
The operators who know their cost per order cold are the ones who can walk into a 3PL renewal and actually move it. Convenience-driven fulfillment choices, made without running the numbers, are consistently 20–40% more expensive than an optimized setup.
A common mistake is benchmarking only the outbound shipment cost and ignoring the return tax sitting behind it. For apparel brands especially, the $11 per-order outbound number looks healthy until you load the $3–$6 per-order return allocation back in.
Usiprep clients see a different picture. Founded by former Amazon sellers, Usiprep built its service specifically around the cost and visibility problems that frustrate growing ecommerce brands. Clients report a 30% reduction in fulfillment costs and a 98.9% on-time delivery rate after switching to Usiprep’s tailored prep and fulfillment model. Faster inventory check-ins and transparent per-order pricing mean brands stop discovering hidden fees on their monthly invoice and start planning from accurate numbers.
Pro Tip: Revisit your fulfillment channel mix every time your monthly order volume crosses a meaningful threshold: 500, 1,500, and 5,000 orders per month are the points where the math on in-house versus 3PL typically flips.
Usiprep gives you lower costs and real visibility from day one
Most ecommerce brands spend months calculating their true cost per order, only to realize their current fulfillment setup is costing them more than it should. Usiprep is the direct alternative: a fulfillment partner built by former Amazon sellers who already know where the hidden costs live and have structured their pricing to eliminate them.
Where generic 3PLs bury fees in receiving, kitting, and account management line items, Usiprep offers transparent, fully loaded pricing with faster inventory check-ins and complete process visibility. Brands that switch typically cut fulfillment costs by 30% while hitting a 98.9% on-time delivery rate, without the operational bottlenecks that come with scaling in-house. Whether you need FBA prep services or direct-to-consumer fulfillment, Usiprep’s model is built to scale with your volume. Check Usiprep’s pricing and see exactly what your per-order cost looks like before you commit.
Key Takeaways
Cost per order fulfillment is a fully loaded metric combining receiving, storage, pick and pack, packaging, shipping, and returns costs, and most brands undercount it by 20–40% by missing overhead and hidden fees.
| Point | Details |
|---|---|
| True cost is fully loaded | Include receiving, storage, pick/pack, packaging, returns, and overhead — not just the headline pick/pack rate. |
| Shipping dominates the bill | Outbound carrier costs account for 50–70% of total fulfillment cost, making shipping the highest-impact optimization target. |
| Volume drives unit cost down | The average all-in fulfillment cost per order excluding shipping typically ranges from $3.00 to $5.50 in 2026 in the U.S., with lower costs at higher volumes. |
| Benchmark against net revenue | A healthy DTC target is 8–12% of net revenue; apparel with high returns often runs 13–18% once returns are allocated. |
| Usiprep cuts costs by 30% | Usiprep clients achieve significant reductions in fulfillment costs and maintain high on-time delivery rates with transparent, fully loaded pricing. |